Kohl Analytics Group specializes in identifying the value contribution of a Financial institutions balance sheet products. We use Activity Based Management (ABM) principles to accurately understand how most costs are attributed to products and then subtract those costs from revenues to create a P&L statement for loan and deposit products. We have found that using ABM principles greatly increases accuracy of those results.
From time to time, Kohl is asked to do "comparison audits" for companies with existing internal profitability solutions whether commercially purchased or home grown. We simply run a company's data through our methodologies using averages from our database of activity times and costs. We then compare our results and Identify any differences.
The differences that are most common and the most dramatic usually occur when looking at how people costs are attributed to different products. This paper shows just one example of how wrong some systems can be.

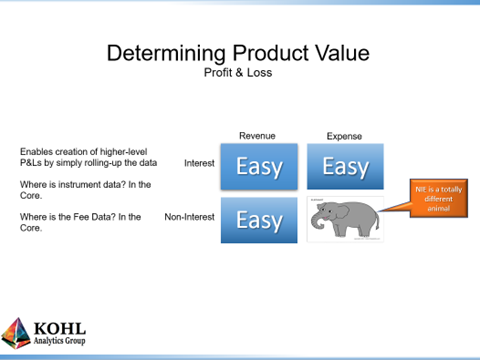
The above graphic depicts the four-common quadrants of revenue and expense for a financial institution. Interest income and expense are comparatively easy to derive at the instrument level as they are simply balance times rate. Non-Interest Income is also comparatively easy as each fee is attached to an instrument so determining this at the instrument level is conceptually straightforward. The hard part is non-interest expense.
The first thing one should understand is that people costs can be around half of all non-interest expense (NIE). Expanding that concept further, most of the rest of NIE is there to support those people. In fact, if you have no people, you have little need for phones, buildings networks, HR etc. As such, people commonly drive about 80% of NIE.
People costs in aggregate are easy. People costs at the department level are readily available as that's hard data in some system somewhere. But how do you attribute those people cost to products or customers? After all, this data rarely exists in any system.
Now, this is where the concept of cost allocations and particularly Activity-Based Management (ABM) come into play. Many institutions will use some proxy such as number of loans or average balances to allocate masses of costs to products and/or customers. The following charts are from a recent Kohl engagement showing the difference in allocation methods for Rewards Credit Cards:
Here are some basic numbers to help explain the next chart:
- Total balance of all loans is $716,767 and loan count is 39,256
- Total balance of the Credit Card portfolio is $62,996 and loan count is 21,068
- Total employee compensation is $6,478 and the amount of employee compensation assigned to Credit Cards using Kohl's ABM methodology is $2,916
Labor Allocations for Reward Credit Cards (in $000)
| Labor Allocations Basis | Basic Calculations (Balance/Total Loans) | Allocation Percent | Total Labor Costs | Labor Allocation | Labor % of Portfolio Balance |
| Portfolio Balance | $62,996/$716,767= | 9% | $6,478 | $583 | 0.92% |
| Portfolio Loan Count | 21,068/39,256 | 54% | $6,478 | $3,498 | 5.55% |
| Kohl ABM Method* | $2,916/$6,478 | 42% | $6,478 | $2,916 | 4.63% |
Next, Kohl views most NIE/overhead to be directed at enabling people to do their jobs as effectively as possible. So, it is more than reasonable to assume that shared services overhead be allocated based on what the production employees actually spend their time on. The following chart shows the differences in the overhead allocation methods:
Overhead Allocations for Rewards Credit Cards (in $000)
| Overhead Allocation Basis | Basic Calculations (Balance/Total Loans) | Allocation Percent | Total Overhead Cost | Overhead Allocation | Overhead % of Portfolio Balance |
| Portfolio Balance | $62,996/$716,767= | 9% | $8,515 | $766 | 1.21% |
| Portfolio Loan Count | 21,068/39,256= | 54% | $8,515 | $4,598 | 7.30% |
| Kohl ABM Method | $2,916/$6,478= | 42% | $8,515 | $3,561 | 5.65% |
So, depending on how you allocated these items, the results can be dramatically different:
- Using Portfolio Balance, the costs are 2.13% (.92% + 1.21%)
- Using Loan Count, the costs are 12.85% (5.55% + 7.30%)
- Using Kohl's ABM method, the costs are 10.28% (4.63% + 5.65%)
Now, comparing the Kohl ABM method and the Loan Count method, you get a cost number greater than the 11.21% Credit Card all-in return and thus, the cards are unprofitable. Using the Portfolio Balance method shows significantly lower costs and the Rewards Credit Cards appear wildly profitable. The issue is that balances and counts have little to do with the effort needed to service any loan and should not be used as an allocation method for servicing. Said differently, there is little difference in the dollar cost to service a $1k loan versus a $5k loan, yet the % cost is very different.
Kohl specializes in accurately mapping what people actually do to the products they actually work on. We have a polished activity dictionary core of around 80 of the most common loan and deposit operational activities and we use that as a basis to gather how much time your people spend on these activities. When you combine this core information with delivery channel and product information, we produce potentially 5,000 or more data points, upwards of 400 per product ,to assign people costs to products. In addition, Kohl has perfected the gathering of this data to the point where it takes less than 15 minutes per operational employee to supply the necessary inputs regardless of whether there are 50 or 50,000 employees.
The bottom line is that if you don't get people costs right, your profitability system is probably wrong across the entire balance sheet. If that is true, then corporate strategy could be wrong too, as the Executive team can unknowingly promote product strategies which decrease the value of the institution and its stakeholders.
