

Many credit unions struggle with the concept of profitability analytics. As not-for-profit entities, many believe profitability should not be the objective. They also mistakenly think profitability analytics is only about maximizing profitability. Both concepts are simply wrong. For credit unions, profitability analytics is about optimizing profitability to appropriate levels, not maximizing it. But what is the appropriate level of profitability?
The “Fiduciary Responsibility” of executives is the safe and sound management of the company. One of the primary buffers against things going wrong is capital. Everyone knows the primary feeding tube to capital is income and that is commonly measured by ROA. But what ROA is needed to maintain a stable capital base?
The formula is simple:
Capital Ratio times Growth Rate
10% x 7% = 70 Basis Points
The 70 basis points represent the optimal ROA to maintain the capital ratio at its current level. Said differently, your capital should grow and the same rate as your assets. This keeps the institution from slowly bleeding capital adequacy over time and having the regulators come calling. Simply, any ROA below this level leads to a decay in capital adequacy.
The OROA for a credit union is different from a bank. Banks look to maximize returns but credit unions strive to optimize returns to the benefit of the membership. Understanding the optimal ROA provides a method to equitably price loans and shares so that one is not making too much or too little. Credit unions serve the membership better by “right pricing” versus “max pricing.”
In 2020, the entire credit union industry saw a substantial decay in capital ratio. Stimulus money poured in resulting in a growth rate of over 17%. With an industry capital ratio of a little over 10%, the industry needed to earn an ROA of 157 BPs just to keep capital ratios at that level, yet the industry only earned 53 BPs. If that growth had continued most of the credit union industry would have faced capital adequacy issues in just a couple of years.
This brings up the issue of profitability analytics and why it is so important even to credit unions. It’s no secret that competition is getting more intense. Industry Net interest Margin has fallen over 100 BPs in the last 4 years. Organizations can ill-afford to make mistakes in pricing and be inefficient in operations and survive long term. A good profitability analytics solution does many things, but two of the most important are:
- Expose pricing issues.
- Reveal operational inefficiencies.
The following chart shows an example of pricing issues:
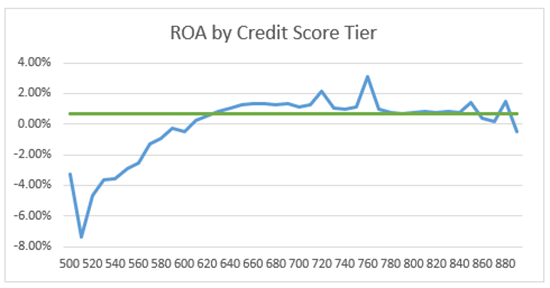
Notice how low credit scores are severely underperforming compared to the green 70 BPs target ROA line? In a well-disciplined pricing program, the ROA for all credit levels should be hovering around the green line. What this graph indicates is that this CU should be pricing the lower credits higher or stay away from these altogether. Ironically, there are curious upward spikes which indicate they are overpricing at specific credit levels and potentially losing good business. This is just one of the many pricing insights a quality profitability analytics solution will reveal.
A good profitability solution will also reveal powerful operational insights. The following chart shows where this organization is doing well in servicing its loans and not so much. It shows that it is good at servicing consumer loans but struggles with mortgages:
